
Overview
Comments can be added to graphs and associated with either a specific point in time or a Y or X axis value.
-
Point comments are useful for highlighting specific data or trends that occurred at a particular point in time.
-
Y axis (Vertical) comments are useful for indicating threshold levels e.g. permanent wilting point, critical frost.
-
X axis (Horizontal) comments are useful for highlighting significant events eg. installed at site, moved to new location, precipitation event.
Creating and Editing Comments
-
Open the graph that you want to add a comment to
-
Hover over the green comment button and then select the pencil icon
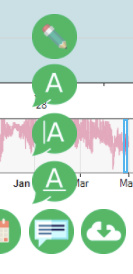
Click on the options:
-
Add vertical comment
-
This makes a comment based on time. i.e. a meter was pulled for repair, an acid flush event occurred
-
Add horizontal comment
-
This make a comment based on the data i.e. thresholds for temperature, management lines for soil moisture sensors
-
-
Add Point comment
-
This makes a comment at a specific point in time and data i.e. finding an event later to discuss with someone what might have happened
-
-

-
For a horizontal comment you will be able to pick a color above and below,
-
Note: keeping in mind that these colors will overlap when setting up multiple comments, such as red and blue will make purple. Green and yellow will make orange.
-
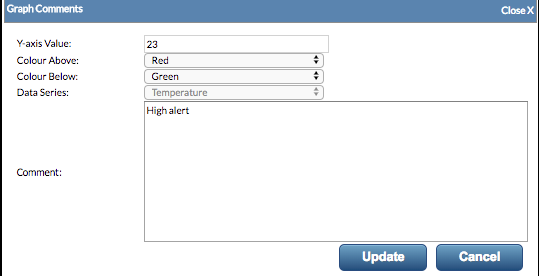
To Edit a Comment
-
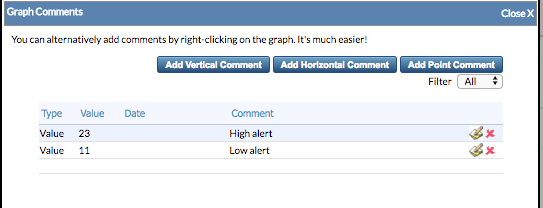
Click on the edit button for the comment that you want to edit.
-
Edit the value (position of the comment), the comment text and for the colors above and below (only for Y axis horizontal comments).
Deleting a Comment
-
Hover over the green comment button at the bottom of the graph and then select the pencil icon
-
Click on the delete button for the comment that you want to delete.
-
Confirm that you want to delete it.