To change the y-axis so that it will space out the data you'll want to change the y-axis range
-
Head over to the graph tab
-
Click on the graph that needs to have their y-axis customized
-
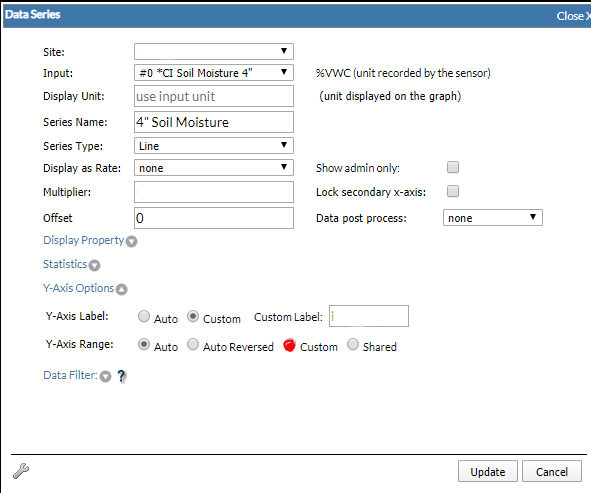
Click on the input that will be turned on all of the time. A data series pop out will appear
-
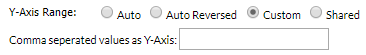
At the bottom where it says "Y-Axis Range" click on "Custom"
-
Insert the y-axis values that are desired
-
Click "Update"
-
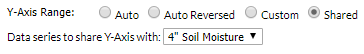
For each input after the first input the data seres will need to be updated as well
-
Click on each input and change the y-axis range to "Shared"
-
The graph will then be formatted to the new range
-
Click the button before exiting.