
There are several different types of soil moisture graphs that can be applied depending on the type of soil moisture probe and your specific needs.
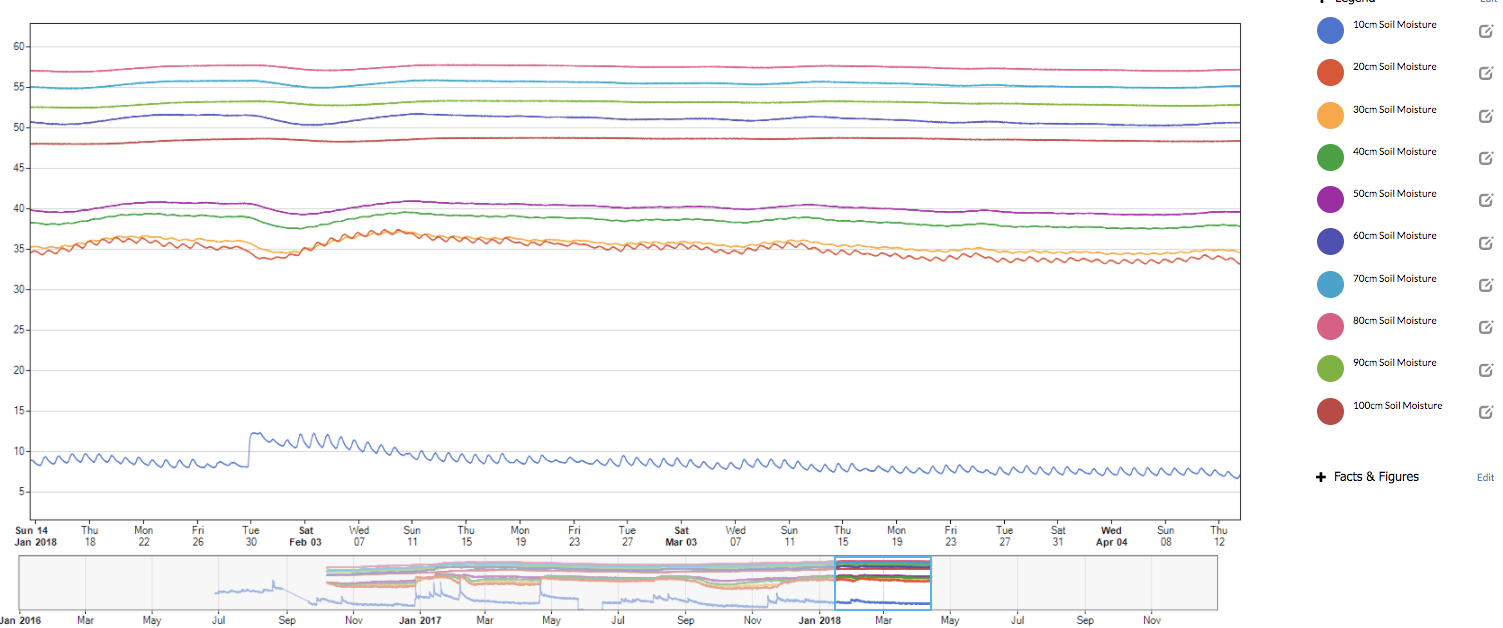
Line Graph Soil Moisture Readings (ordered by soil moisture measurement)
These graphs show soil moisture readings on a standard line graph with a Y axis showing the soil moisture reading for each sensor depth. The reading lines are not in order of the sensor depth, but are in order of the soil moisture readings.
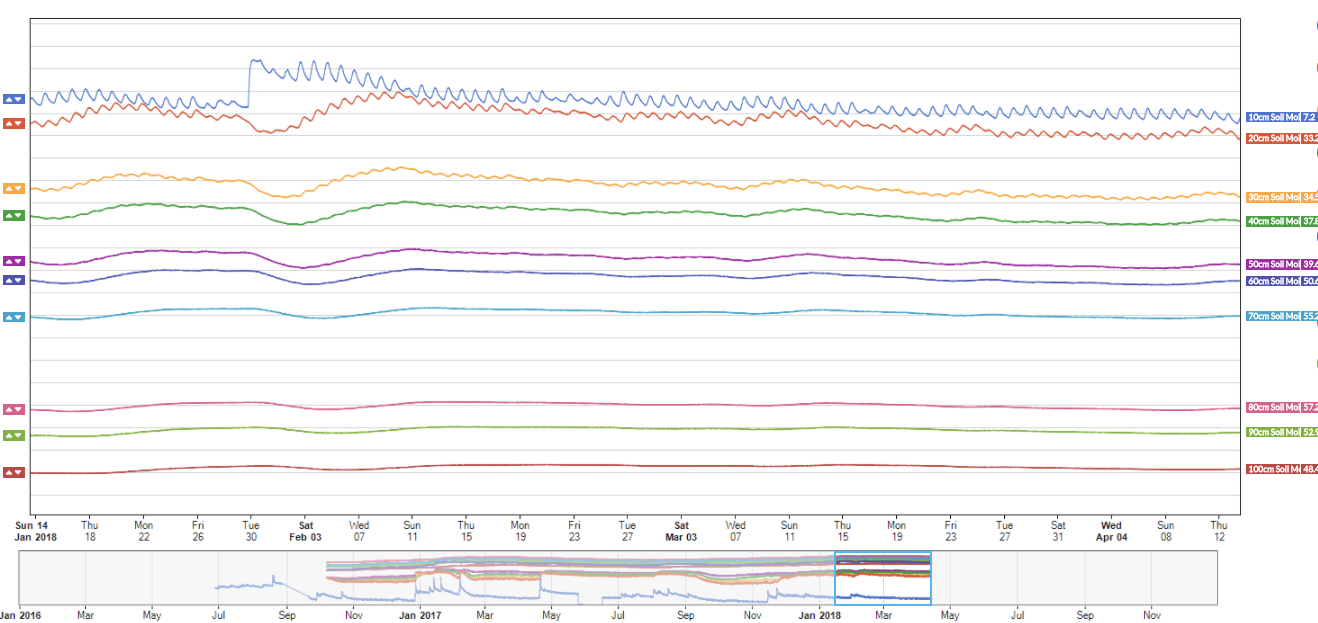
Stacked Soil Moisture Readings (ordered by soil depth)
These graphs allow you to arrange soil moisture readings in in order of their soil depth. Because the emphasis is on soil depth, there is no visible Y axis of the readings. It is however possible to view the latest readings on the right hand side of the graph or by hovering over the specific point in time you'd like to see readings for.
Summed Soil Moisture
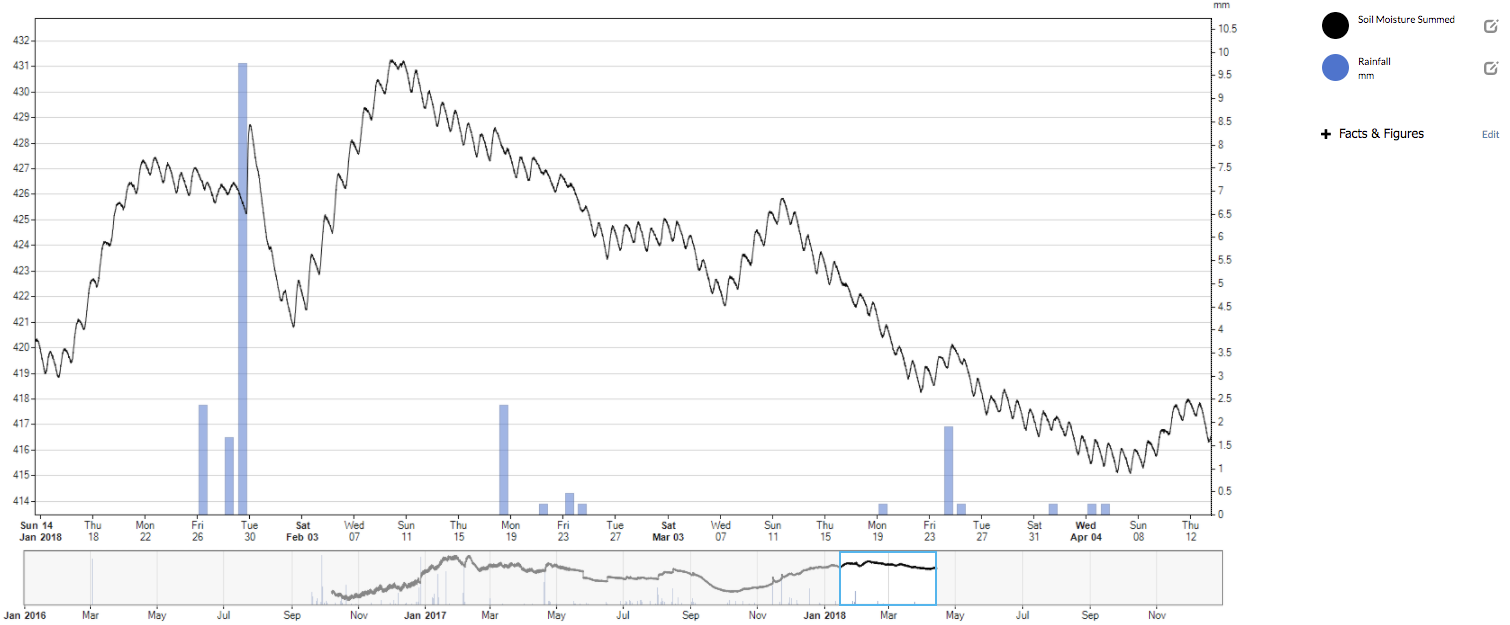
This graph sums soil moisture across all sensor depths to give an aggregate view of the soil profile. Rainfall and irrigation events can also be included on this graph if this data is available.