The Growth Stages feature allows you to define specific FWC (Field Water Capacity), Refill, and Stress thresholds on your graphs, for distinct stages of your crop's annual growth cycle.
For example, a monitored crop might have the following stages:
-
Sowing: April to May
-
Emergence: May to June
-
Vegetative Growth: June to August
-
Reproductive stage: August to September
-
Grain Fill: September to October
-
Maturation: October to November
-
Harvest: November to December
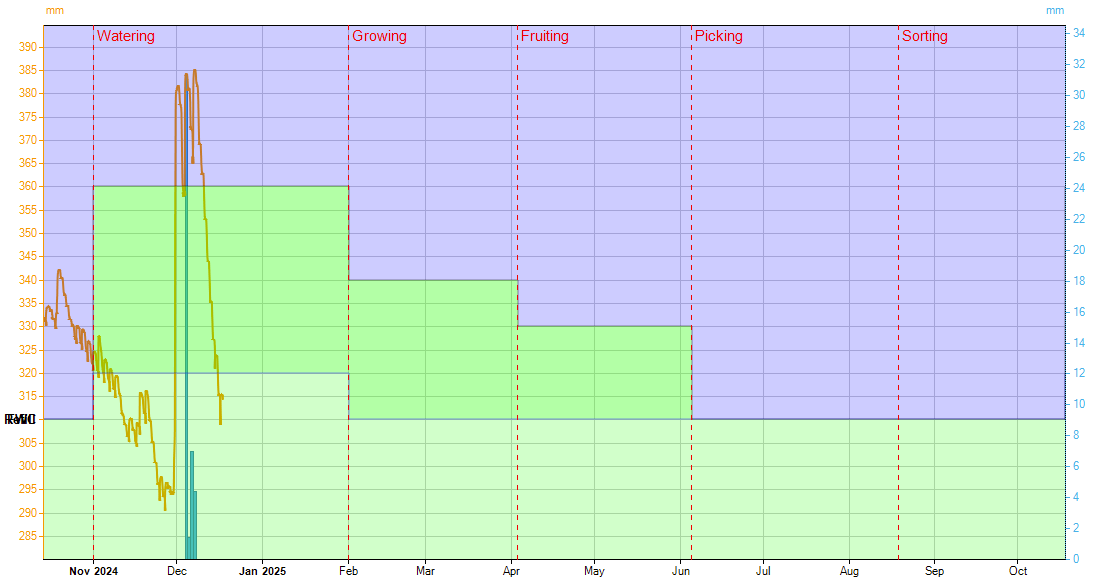
Each stage can have customised FWC, Refill, and Stress thresholds. These threshold lines provide clear guidance for monitoring soil moisture levels specific to your crop's current growth stage.
Enabling Growth Stages
To enable the Growth Stages feature on any graph:
Growth stages are only displayed when a graph contains 1 Soil Moisture Input, and it has a Measurement Category of Soil Moisture. If there are multiple soil moisture inputs, eg from a multi-level probe, Growth stages can’t be displayed.
-
Click on the Soil Moisture icon below the graph

-
Slide the switch to the Growth Stages position. New fields will appear below, relating to Growth Stages.

Configuring Growth Stages
Growth Stage values are saved against the input used on the graph. If 2 graphs use the same input, they will share the same Growth Stage values
When Growth Stages is enabled, fields to define moisture levels during each stage will be displayed. (Example below)
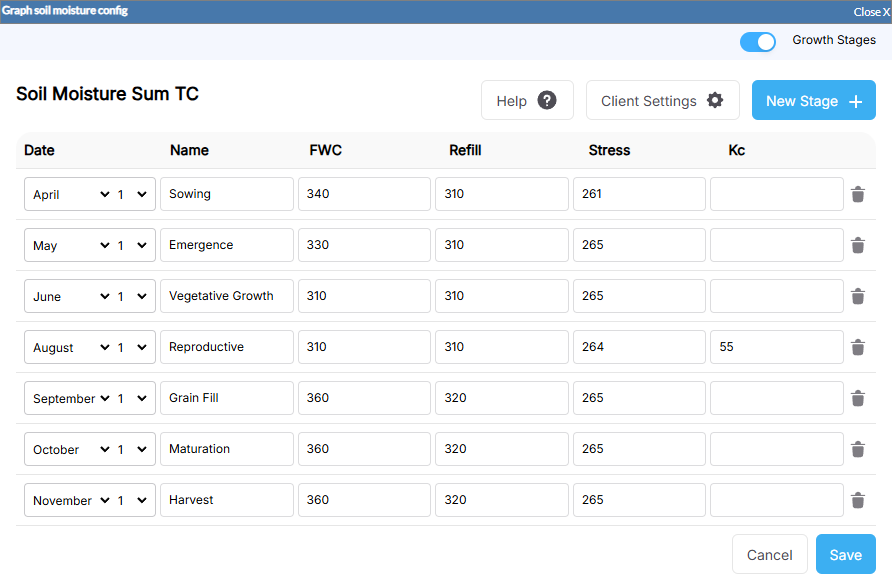
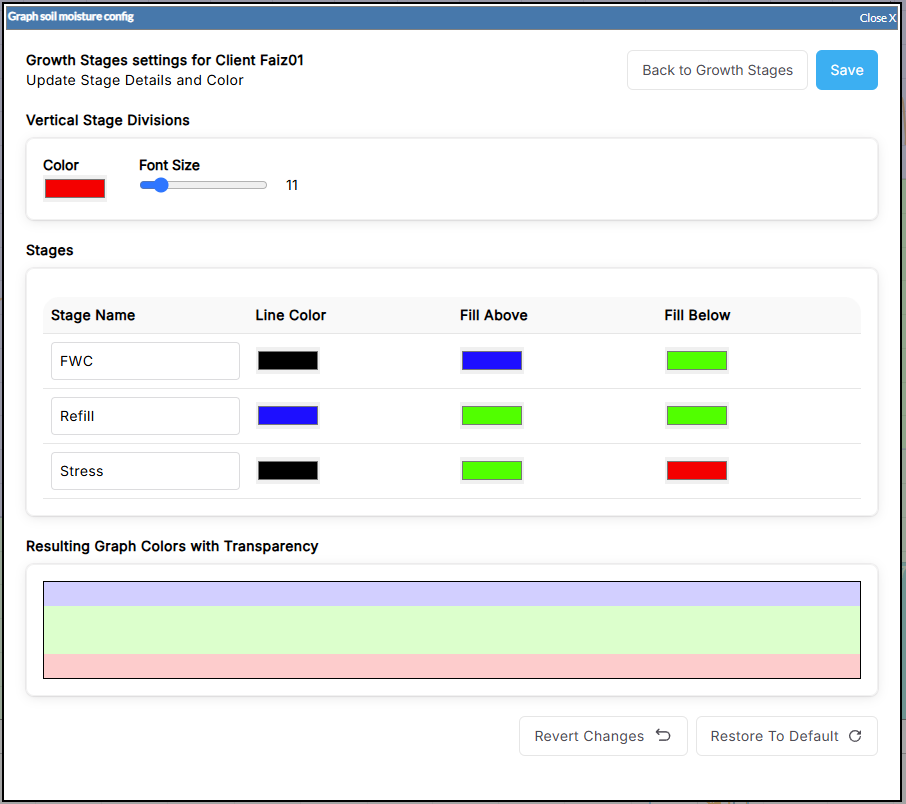
You can define your own stage names and dates, and save the FWC, Refill, and Stress points for each stage.
Click the New Stage button 
![]()
Click Client Settings