
|
Date Released |
Platform |
Feature |
Description |
|---|---|---|---|
|
Q1 |
|
|
|
|
28th Jan |
🖥️ Web |
Growth Stages |
The Growth Stages feature allows you to define specific FWC (Field Water Capacity), Refill, and Stress thresholds on your graphs, for distinct stages of your crop's annual growth cycle. 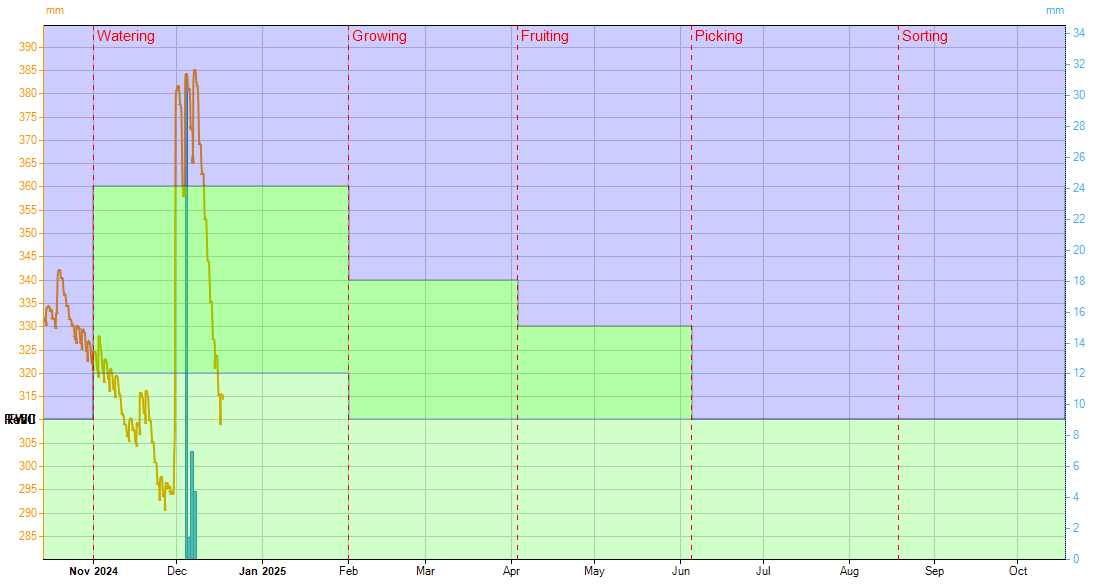
For more info see Growth Stages |
|
22nd Jan |
🖥️ Web |
Alarm tags |
You can now add #Tags to alarm messages, to insert logger-specific information into your message wording. Eg “#inputname has risen above #alarmsetvalue #unit” will sends the alarm message as “West dam water level has risen above 2.75m” See Alarm Tags |
|
22nd Jan |
🖥️ Web |
Customisable Duration for Facts & Figures Calculations |
We’re excited to introduce a new feature that gives you more control over your Facts & Figures calculations. Previously, F&F calculations automatically matched the duration displayed on the graph. With this update, you now have the flexibility to manually specify the duration over which the calculations are performed. This enhancement ensures more precise insights tailored to your needs. 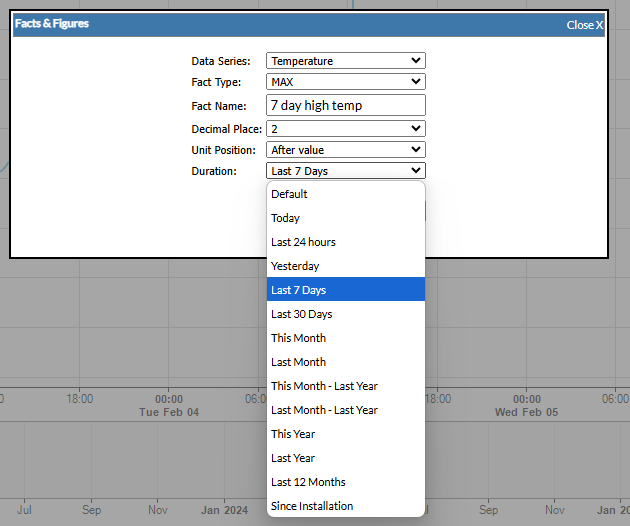
|
|
22nd Jan |
🖥️ Web |
Display timezone information on the input data tab |
This change makes it clearer which timezone the data is shown in. It also allows the csv export to be in either Site Timezone, or data Timezone (UTC) 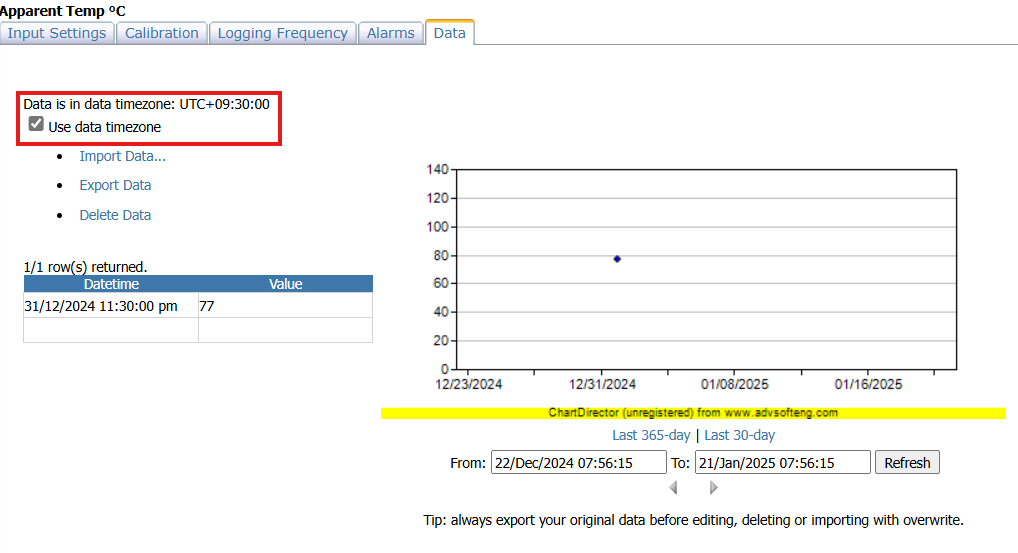
|
|
22nd Jan |
🖥️ Web |
Coloured Y-axis |
This update ensures the Y-axis colour matches the graph series colour, when multiple Y-axis exists. 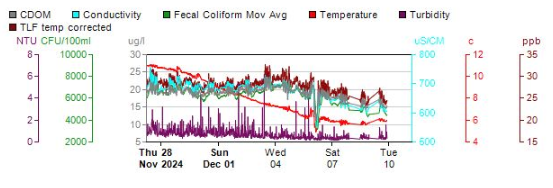
|
|
22nd Jan |
🖥️ Web |
Show meter reading unit of measure |
On a water flow graph with meter-readings set up, the unit has now been added to the popup window. 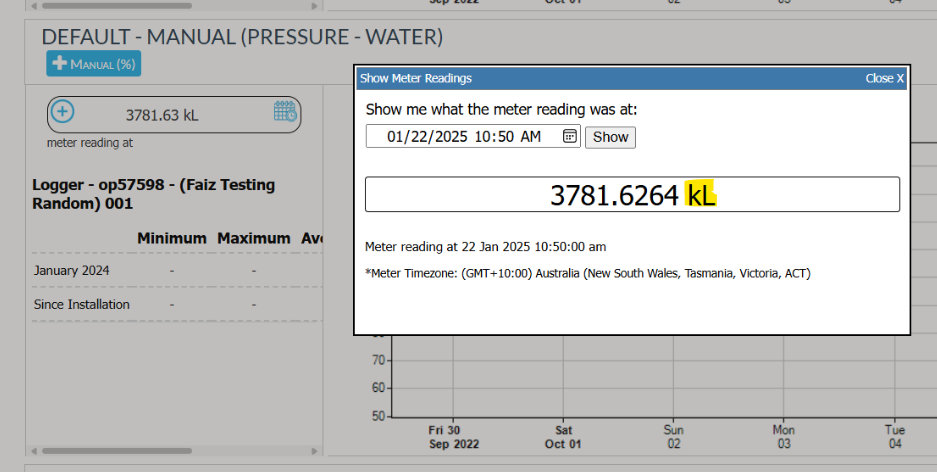
|
|
|
|
|
|